PDF Publication Title:
Text from PDF Page: 023
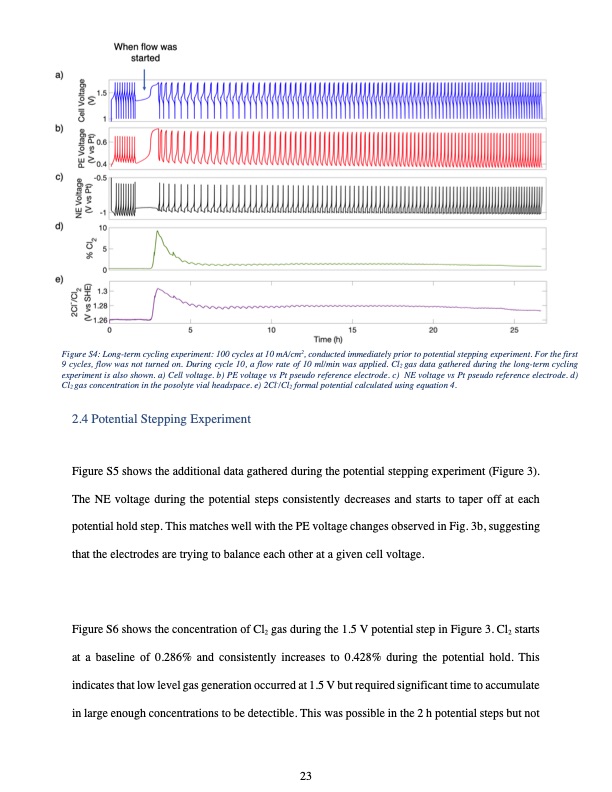
Figure S4: Long-term cycling experiment: 100 cycles at 10 mA/cm2, conducted immediately prior to potential stepping experiment. For the first 9 cycles, flow was not turned on. During cycle 10, a flow rate of 10 ml/min was applied. Cl2 gas data gathered during the long-term cycling experiment is also shown. a) Cell voltage. b) PE voltage vs Pt pseudo reference electrode. c) NE voltage vs Pt pseudo reference electrode. d) Cl2 gas concentration in the posolyte vial headspace. e) 2Cl-/Cl2 formal potential calculated using equation 4. 2.4 Potential Stepping Experiment Figure S5 shows the additional data gathered during the potential stepping experiment (Figure 3). The NE voltage during the potential steps consistently decreases and starts to taper off at each potential hold step. This matches well with the PE voltage changes observed in Fig. 3b, suggesting that the electrodes are trying to balance each other at a given cell voltage. Figure S6 shows the concentration of Cl2 gas during the 1.5 V potential step in Figure 3. Cl2 starts at a baseline of 0.286% and consistently increases to 0.428% during the potential hold. This indicates that low level gas generation occurred at 1.5 V but required significant time to accumulate in large enough concentrations to be detectible. This was possible in the 2 h potential steps but not 23PDF Image | Chlorine Gas Generation in Mixed-Acid Vanadium Redox
PDF Search Title:
Chlorine Gas Generation in Mixed-Acid Vanadium RedoxOriginal File Name Searched:
gas-evolution-vanadium-redox.pdfDIY PDF Search: Google It | Yahoo | Bing
Salgenx Redox Flow Battery Technology: Power up your energy storage game with Salgenx Salt Water Battery. With its advanced technology, the flow battery provides reliable, scalable, and sustainable energy storage for utility-scale projects. Upgrade to a Salgenx flow battery today and take control of your energy future.
CONTACT TEL: 608-238-6001 Email: greg@salgenx.com (Standard Web Page)