PDF Publication Title:
Text from PDF Page: 008
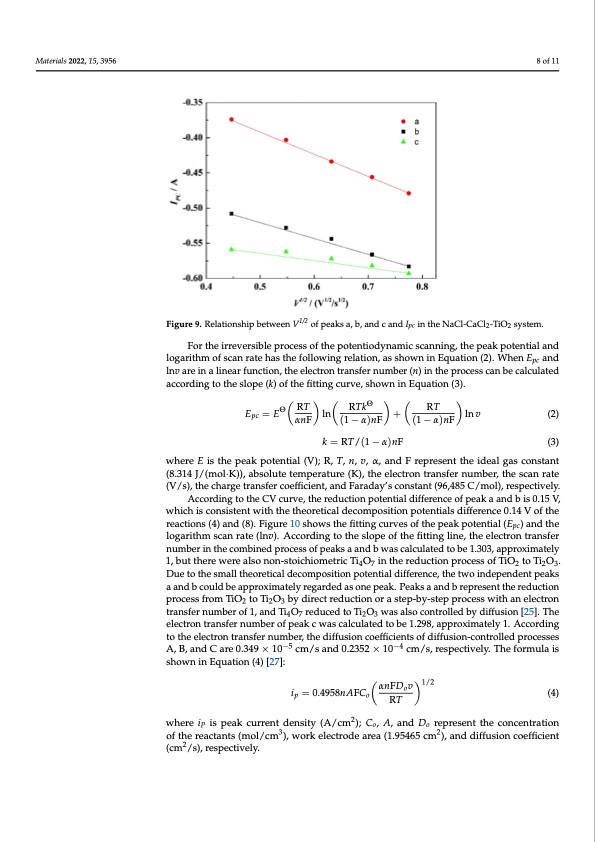
Materials 2022, 15, 3956 8 of 11 Figure 8. CV curves of the NaCl-CaCl2-TiO2 system with different scan rate. 1/2 Figure 9. Relationship between V of peaks a, b, and c and Ipc in the NaCl-CaCl2-TiO2 system. Figure 9. Relationship between V of peaks a, b, and c and Ipc in the NaCl-CaCl2-TiO2 system. Forrttheiirrreverrssiiblleprrocceesssofftthepotteenttiiodynamiiccssccanniing,,tthepeakpottenttiialland logarithm of scan rate has the following relation, as shown in Equation (2). When E and logarithm of scan rate has the following relation, as shown in Equation (2). When Epcpc and lnv are in a linear function, the electron transfer number (n) in the process can be calculated lnv are in a linear function, the electron transfer number (n) in the process can be calcu- according to the slope (k) of the fitting curve, shown in Equation (3). lated according to the slope (k) of the fitting curve, shown in Equation (3). RT RTkΘ Θ RT Θ Θ RT E =E =E ln ln RTk αnF (1−α)nF (1−α)nF RT αnF (1−α)nF (1−α)nF ++ k = RT/(1 − α)nF (3) pc pc k=RT (1−α)nF (3) lnlvnv (2) (2) where E is the peak potential (V); R, T, n, v, α, and F represent the ideal gas constant where E is the peak potential (V); R, T, n, v, α, and F represent the ideal gas constant (8.314 J/(mol·K)), absolute temperature (K), the electron transfer number, the scan rate (8.314 J/(mol·K)), absolute temperature (K), the electron transfer number, the scan rate (V/s), the charge transfer coefficient, and Faraday’s constant (96,485 C/mol), respectively. (V/s), the charge transfer coefficient, and Faraday’s constant (96485 C/mol), respectively. According to the CV curve, the reduction potential difference of peak a and b is 0.15 V, According to the CV curve, the reduction potential difference of peak a and b is 0.15 which is consistent with the theoretical decomposition potentials difference 0.14 V of the V, which is consistent with the theoretical decomposition potentials difference 0.14 V of reactions (4) and (8). Figure 10 shows the fitting curves of the peak potential (Epc) and the ltohgeareitahcmtiosncsa(n4)ratned(l(n8v).).FiAgcucroer1d0insghotowtshteheslfoiptteinogf ctuhrevfietstionfgthlienpe,eathkepeolteecntrtioanl (tErapcn) safnedr number in the combined process of peaks a and b was calculated to be 1.303, approximately 1, but there were also non-stoichiometric Ti4O7 in the reduction process of TiO2 to Ti2O3. Due to the small theoretical decomposition potential difference, the two independent peaks a and b could be approximately regarded as one peak. Peaks a and b represent the reduction process from TiO2 to Ti2O3 by direct reduction or a step-by-step process with an electron transfer number of 1, and Ti4O7 reduced to Ti2O3 was also controlled by diffusion [25]. The electron transfer number of peak c was calculated to be 1.298, approximately 1. According to the electron transfer number, the diffusion coefficients of diffusion-controlled processes A, B, and C are 0.349 × 10⁻⁵ cm/s and 0.2352 × 10⁻⁴ cm/s, respectively. The formula is shown in Equation (4) [27]: αnFDo v 1/2 ip = 0.4958nAFCo RT (4) where iP is peak current density (A/cm2); Co, A, and Do represent the concentration of the reactants (mol/cm3), work electrode area (1.95465 cm2), and diffusion coefficient (cm2/s), respectively.PDF Image | Electrochemical Mechanism of Molten Salt Electrolysis
PDF Search Title:
Electrochemical Mechanism of Molten Salt ElectrolysisOriginal File Name Searched:
materials-15-03956.pdfDIY PDF Search: Google It | Yahoo | Bing
Salgenx Redox Flow Battery Technology: Power up your energy storage game with Salgenx Salt Water Battery. With its advanced technology, the flow battery provides reliable, scalable, and sustainable energy storage for utility-scale projects. Upgrade to a Salgenx flow battery today and take control of your energy future.
CONTACT TEL: 608-238-6001 Email: greg@salgenx.com (Standard Web Page)