PDF Publication Title:
Text from PDF Page: 010
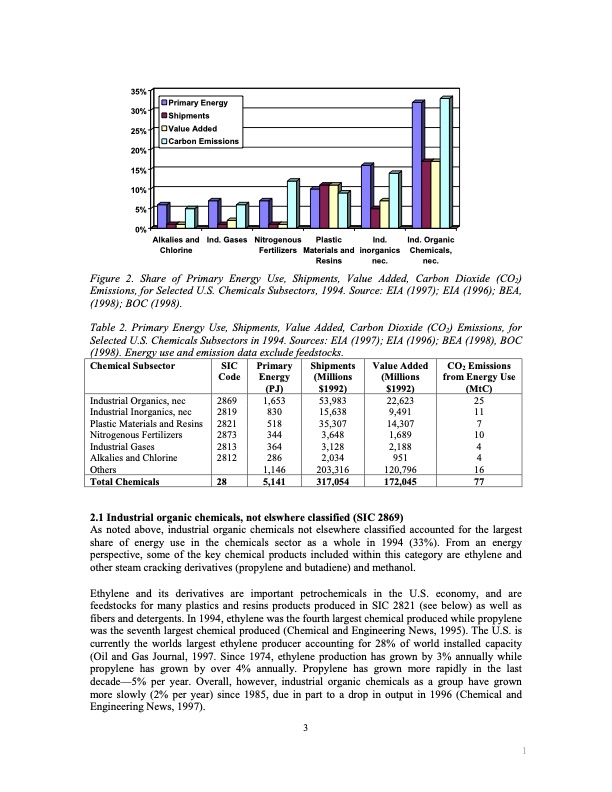
35% 30% 25% 20% 15% 10% 5% 0% Primary Energy Shipments Value Added Carbon Emissions Alkalies and Chlorine Ind. Gases Nitrogenous Fertilizers Plastic Materials and Resins Ind. Ind. Organic inorganics Chemicals, nec. nec. Figure 2. Share of Primary Energy Use, Shipments, Value Added, Carbon Dioxide (CO2) Emissions, for Selected U.S. Chemicals Subsectors, 1994. Source: EIA (1997); EIA (1996); BEA, (1998); BOC (1998). Table 2. Primary Energy Use, Shipments, Value Added, Carbon Dioxide (CO2) Emissions, for Selected U.S. Chemicals Subsectors in 1994. Sources: EIA (1997); EIA (1996); BEA (1998), BOC (1998). Energy use and emission data exclude feedstocks. Chemical Subsector Industrial Organics, nec Industrial Inorganics, nec Plastic Materials and Resins Nitrogenous Fertilizers Industrial Gases Alkalies and Chlorine Others Total Chemicals SIC Primary Shipments Code Energy (Millions (PJ) $1992) 2869 1,653 53,983 2819 830 15,638 2821 518 35,307 2873 344 3,648 2813 364 3,128 2812 286 2,034 1,146 203,316 28 5,141 317,054 Value Added (Millions $1992) 22,623 9,491 14,307 1,689 2,188 951 120,796 172,045 CO2 Emissions from Energy Use (MtC) 25 11 7 10 4 4 16 77 2.1 Industrial organic chemicals, not elswhere classified (SIC 2869) As noted above, industrial organic chemicals not elsewhere classified accounted for the largest share of energy use in the chemicals sector as a whole in 1994 (33%). From an energy perspective, some of the key chemical products included within this category are ethylene and other steam cracking derivatives (propylene and butadiene) and methanol. Ethylene and its derivatives are important petrochemicals in the U.S. economy, and are feedstocks for many plastics and resins products produced in SIC 2821 (see below) as well as fibers and detergents. In 1994, ethylene was the fourth largest chemical produced while propylene was the seventh largest chemical produced (Chemical and Engineering News, 1995). The U.S. is currently the worlds largest ethylene producer accounting for 28% of world installed capacity (Oil and Gas Journal, 1997. Since 1974, ethylene production has grown by 3% annually while propylene has grown by over 4% annually. Propylene has grown more rapidly in the last decade—5% per year. Overall, however, industrial organic chemicals as a group have grown more slowly (2% per year) since 1985, due in part to a drop in output in 1996 (Chemical and Engineering News, 1997). 3 1PDF Image | Energy use and energy intensity
PDF Search Title:
Energy use and energy intensityOriginal File Name Searched:
qt2925w8g6.pdfDIY PDF Search: Google It | Yahoo | Bing
Salgenx Redox Flow Battery Technology: Power up your energy storage game with Salgenx Salt Water Battery. With its advanced technology, the flow battery provides reliable, scalable, and sustainable energy storage for utility-scale projects. Upgrade to a Salgenx flow battery today and take control of your energy future.
| CONTACT TEL: 608-238-6001 Email: greg@salgenx.com | RSS | AMP |