PDF Publication Title:
Text from PDF Page: 013
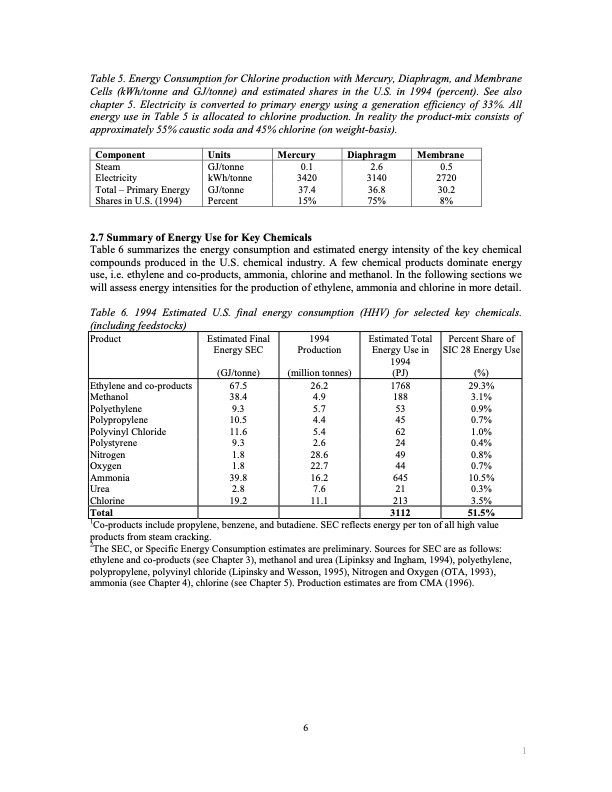
Table 5. Energy Consumption for Chlorine production with Mercury, Diaphragm, and Membrane Cells (kWh/tonne and GJ/tonne) and estimated shares in the U.S. in 1994 (percent). See also chapter 5. Electricity is converted to primary energy using a generation efficiency of 33%. All energy use in Table 5 is allocated to chlorine production. In reality the product-mix consists of approximately 55% caustic soda and 45% chlorine (on weight-basis). Component Steam Electricity Total – Primary Energy Shares in U.S. (1994) Units GJ/tonne kWh/tonne GJ/tonne Percent Mercury Diaphragm Membrane 0.1 2.6 0.5 3420 3140 2720 37.4 36.8 30.2 15% 75% 8% 2.7 Summary of Energy Use for Key Chemicals Table 6 summarizes the energy consumption and estimated energy intensity of the key chemical compounds produced in the U.S. chemical industry. A few chemical products dominate energy use, i.e. ethylene and co-products, ammonia, chlorine and methanol. In the following sections we will assess energy intensities for the production of ethylene, ammonia and chlorine in more detail. Table 6. 1994 Estimated U.S. final energy consumption (HHV) for selected key chemicals. (including feedstocks) Product Estimated Final Energy SEC (GJ/tonne) 1994 Production (million tonnes) Estimated Total Energy Use in 1994 (PJ) Percent Share of SIC 28 Energy Use (%) Ethylene and co-products Methanol Polyethylene Polypropylene Polyvinyl Chloride Polystyrene Nitrogen Oxygen Ammonia Urea Chlorine Total 1Co-products include propylene, benzene, and butadiene. SEC reflects energy per ton of all high value products from steam cracking. 2The SEC, or Specific Energy Consumption estimates are preliminary. Sources for SEC are as follows: ethylene and co-products (see Chapter 3), methanol and urea (Lipinksy and Ingham, 1994), polyethylene, polypropylene, polyvinyl chloride (Lipinsky and Wesson, 1995), Nitrogen and Oxygen (OTA, 1993), ammonia (see Chapter 4), chlorine (see Chapter 5). Production estimates are from CMA (1996). 67.5 26.2 38.4 4.9 9.3 5.7 10.5 4.4 11.6 5.4 9.3 2.6 1.8 28.6 1768 29.3% 188 3.1% 53 0.9% 45 0.7% 62 1.0% 24 0.4% 49 0.8% 44 0.7% 1.8 22.7 39.8 16.2 2.8 7.6 19.2 11.1 645 10.5% 21 0.3% 213 3.5% 3112 51.5% 6 1PDF Image | Energy use and energy intensity
PDF Search Title:
Energy use and energy intensityOriginal File Name Searched:
qt2925w8g6.pdfDIY PDF Search: Google It | Yahoo | Bing
Salgenx Redox Flow Battery Technology: Power up your energy storage game with Salgenx Salt Water Battery. With its advanced technology, the flow battery provides reliable, scalable, and sustainable energy storage for utility-scale projects. Upgrade to a Salgenx flow battery today and take control of your energy future.
CONTACT TEL: 608-238-6001 Email: greg@salgenx.com (Standard Web Page)