PDF Publication Title:
Text from PDF Page: 021
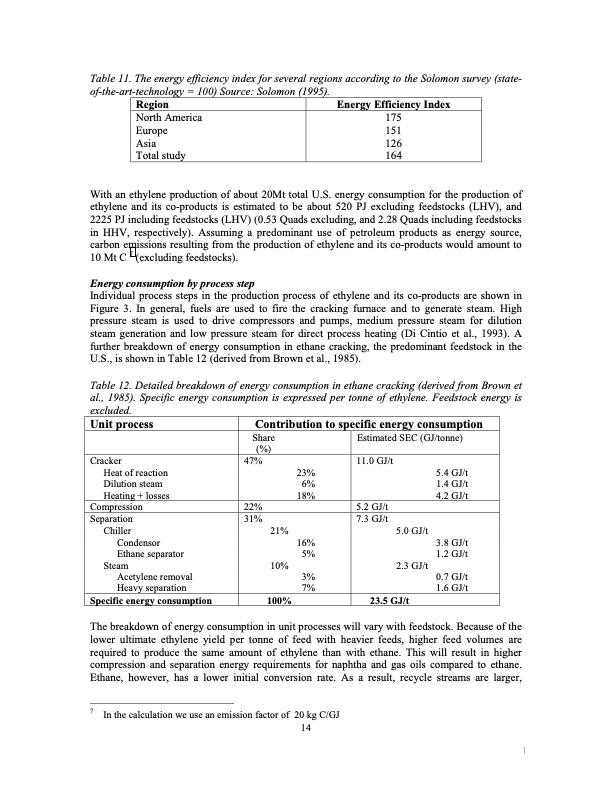
Table 11. The energy efficiency index for several regions according to the Solomon survey (state- of-the-art-technology = 100) Source: Solomon (1995). Region North America Europe Asia Total study Energy Efficiency Index 175 151 126 164 With an ethylene production of about 20Mt total U.S. energy consumption for the production of ethylene and its co-products is estimated to be about 520 PJ excluding feedstocks (LHV), and 2225 PJ including feedstocks (LHV) (0.53 Quads excluding, and 2.28 Quads including feedstocks in HHV, respectively). Assuming a predominant use of petroleum products as energy source, carbon emissions resulting from the production of ethylene and its co-products would amount to 10 Mt C 7 (excluding feedstocks). Energy consumption by process step Individual process steps in the production process of ethylene and its co-products are shown in Figure 3. In general, fuels are used to fire the cracking furnace and to generate steam. High pressure steam is used to drive compressors and pumps, medium pressure steam for dilution steam generation and low pressure steam for direct process heating (Di Cintio et al., 1993). A further breakdown of energy consumption in ethane cracking, the predominant feedstock in the U.S., is shown in Table 12 (derived from Brown et al., 1985). Table 12. Detailed breakdown of energy consumption in ethane cracking (derived from Brown et al., 1985). Specific energy consumption is expressed per tonne of ethylene. Feedstock energy is excluded. Unit process Contribution to specific energy consumption Share (%) Estimated SEC (GJ/tonne) 11.0 GJ/t Cracker Heat of reaction Dilution steam Heating + losses Compression Separation Chiller Condensor Ethane separator Steam Acetylene removal Heavy separation Specific energy consumption 47% 22% 31% 23% 6% 18% 16% 5% 3% 7% 5.2 GJ/t 7.3 GJ/t 23.5 GJ/t 5.4 GJ/t 1.4 GJ/t 4.2 GJ/t 3.8 GJ/t 1.2 GJ/t 0.7 GJ/t 1.6 GJ/t 21% 10% 100% 5.0 GJ/t 2.3 GJ/t The breakdown of energy consumption in unit processes will vary with feedstock. Because of the lower ultimate ethylene yield per tonne of feed with heavier feeds, higher feed volumes are required to produce the same amount of ethylene than with ethane. This will result in higher compression and separation energy requirements for naphtha and gas oils compared to ethane. Ethane, however, has a lower initial conversion rate. As a result, recycle streams are larger, 7 In the calculation we use an emission factor of 20 kg C/GJ 14 1PDF Image | Energy use and energy intensity
PDF Search Title:
Energy use and energy intensityOriginal File Name Searched:
qt2925w8g6.pdfDIY PDF Search: Google It | Yahoo | Bing
Salgenx Redox Flow Battery Technology: Power up your energy storage game with Salgenx Salt Water Battery. With its advanced technology, the flow battery provides reliable, scalable, and sustainable energy storage for utility-scale projects. Upgrade to a Salgenx flow battery today and take control of your energy future.
| CONTACT TEL: 608-238-6001 Email: greg@salgenx.com | RSS | AMP |