PDF Publication Title:
Text from PDF Page: 026
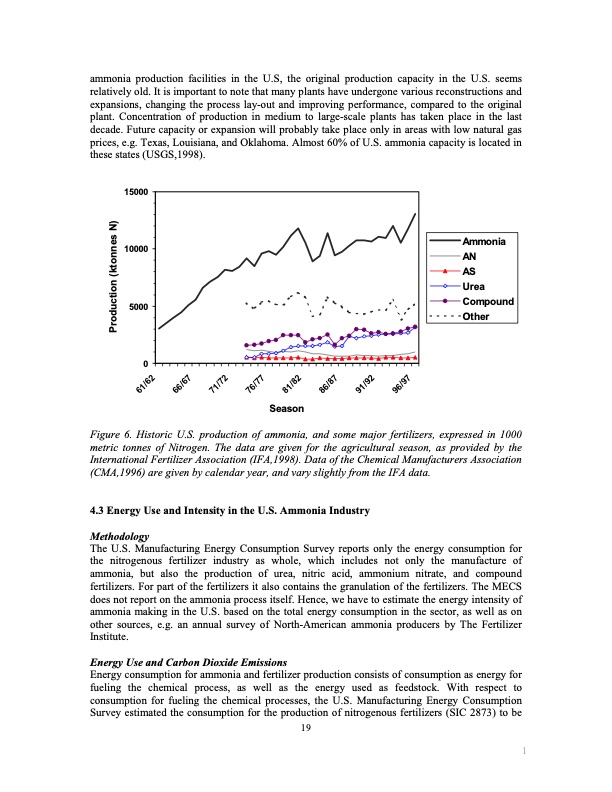
ammonia production facilities in the U.S, the original production capacity in the U.S. seems relatively old. It is important to note that many plants have undergone various reconstructions and expansions, changing the process lay-out and improving performance, compared to the original plant. Concentration of production in medium to large-scale plants has taken place in the last decade. Future capacity or expansion will probably take place only in areas with low natural gas prices, e.g. Texas, Louisiana, and Oklahoma. Almost 60% of U.S. ammonia capacity is located in these states (USGS,1998). 15000 10000 5000 0 Season Ammonia AN AS Urea Compound Other Figure 6. Historic U.S. production of ammonia, and some major fertilizers, expressed in 1000 metric tonnes of Nitrogen. The data are given for the agricultural season, as provided by the International Fertilizer Association (IFA,1998). Data of the Chemical Manufacturers Association (CMA,1996) are given by calendar year, and vary slightly from the IFA data. 4.3 Energy Use and Intensity in the U.S. Ammonia Industry Methodology The U.S. Manufacturing Energy Consumption Survey reports only the energy consumption for the nitrogenous fertilizer industry as whole, which includes not only the manufacture of ammonia, but also the production of urea, nitric acid, ammonium nitrate, and compound fertilizers. For part of the fertilizers it also contains the granulation of the fertilizers. The MECS does not report on the ammonia process itself. Hence, we have to estimate the energy intensity of ammonia making in the U.S. based on the total energy consumption in the sector, as well as on other sources, e.g. an annual survey of North-American ammonia producers by The Fertilizer Institute. Energy Use and Carbon Dioxide Emissions Energy consumption for ammonia and fertilizer production consists of consumption as energy for fueling the chemical process, as well as the energy used as feedstock. With respect to consumption for fueling the chemical processes, the U.S. Manufacturing Energy Consumption Survey estimated the consumption for the production of nitrogenous fertilizers (SIC 2873) to be 19 1 Production (ktonnes N) 61/62 66/67 71/72 76/77 81/82 86/87 91/92 96/97PDF Image | Energy use and energy intensity
PDF Search Title:
Energy use and energy intensityOriginal File Name Searched:
qt2925w8g6.pdfDIY PDF Search: Google It | Yahoo | Bing
Salgenx Redox Flow Battery Technology: Power up your energy storage game with Salgenx Salt Water Battery. With its advanced technology, the flow battery provides reliable, scalable, and sustainable energy storage for utility-scale projects. Upgrade to a Salgenx flow battery today and take control of your energy future.
CONTACT TEL: 608-238-6001 Email: greg@salgenx.com (Standard Web Page)