PDF Publication Title:
Text from PDF Page: 028
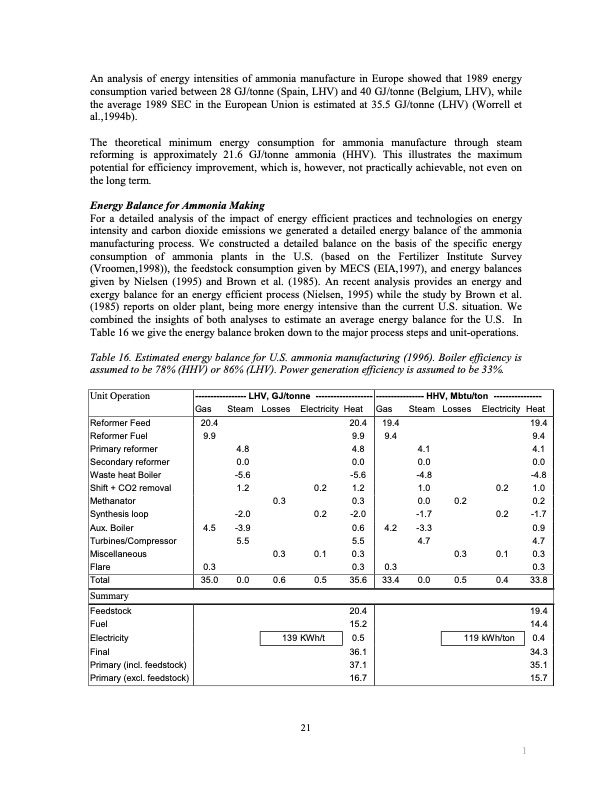
An analysis of energy intensities of ammonia manufacture in Europe showed that 1989 energy consumption varied between 28 GJ/tonne (Spain, LHV) and 40 GJ/tonne (Belgium, LHV), while the average 1989 SEC in the European Union is estimated at 35.5 GJ/tonne (LHV) (Worrell et al.,1994b). The theoretical minimum energy consumption for ammonia manufacture through steam reforming is approximately 21.6 GJ/tonne ammonia (HHV). This illustrates the maximum potential for efficiency improvement, which is, however, not practically achievable, not even on the long term. Energy Balance for Ammonia Making For a detailed analysis of the impact of energy efficient practices and technologies on energy intensity and carbon dioxide emissions we generated a detailed energy balance of the ammonia manufacturing process. We constructed a detailed balance on the basis of the specific energy consumption of ammonia plants in the U.S. (based on the Fertilizer Institute Survey (Vroomen,1998)), the feedstock consumption given by MECS (EIA,1997), and energy balances given by Nielsen (1995) and Brown et al. (1985). An recent analysis provides an energy and exergy balance for an energy efficient process (Nielsen, 1995) while the study by Brown et al. (1985) reports on older plant, being more energy intensive than the current U.S. situation. We combined the insights of both analyses to estimate an average energy balance for the U.S. In Table 16 we give the energy balance broken down to the major process steps and unit-operations. Table 16. Estimated energy balance for U.S. ammonia manufacturing (1996). Boiler efficiency is assumed to be 78% (HHV) or 86% (LHV). Power generation efficiency is assumed to be 33%. Unit Operation Reformer Feed Reformer Fuel Primary reformer Secondary reformer Waste heat Boiler Shift + CO2 removal Methanator 0.3 20.4 19.4 9.9 9.4 4.8 4.1 0.0 0.0 -5.6 -4.8 1.2 1.0 0.3 0.0 0.2 -2.0 -1.7 0.6 4.2 -3.3 5.5 4.7 0.3 0.3 0.3 0.3 35.6 33.4 0.0 0.5 19.4 9.4 4.1 0.0 -4.8 1.0 0.2 -1.7 0.9 4.7 0.3 0.3 33.8 19.4 14.4 0.4 34.3 35.1 15.7 Synthesis loop Aux. Boiler Turbines/Compressor Miscellaneous 0.3 Flare Total Summary Feedstock Fuel Electricity Final Primary (incl. feedstock) Primary (excl. feedstock) 0.3 35.0 0.0 0.6 ----------------- LHV, GJ/tonne ------------------- ---------------- HHV, Mbtu/ton ---------------- Gas Steam Losses Electricity Heat Gas Steam Losses Electricity Heat 20.4 9.9 -2.0 4.5 -3.9 5.5 4.8 0.0 -5.6 1.2 0.2 0.2 0.1 0.5 0.2 0.2 0.1 0.4 139 KWh/t 20.4 15.2 0.5 36.1 37.1 16.7 119 kWh/ton 21 1PDF Image | Energy use and energy intensity
PDF Search Title:
Energy use and energy intensityOriginal File Name Searched:
qt2925w8g6.pdfDIY PDF Search: Google It | Yahoo | Bing
Salgenx Redox Flow Battery Technology: Power up your energy storage game with Salgenx Salt Water Battery. With its advanced technology, the flow battery provides reliable, scalable, and sustainable energy storage for utility-scale projects. Upgrade to a Salgenx flow battery today and take control of your energy future.
| CONTACT TEL: 608-238-6001 Email: greg@salgenx.com | RSS | AMP |