PDF Publication Title:
Text from PDF Page: 030
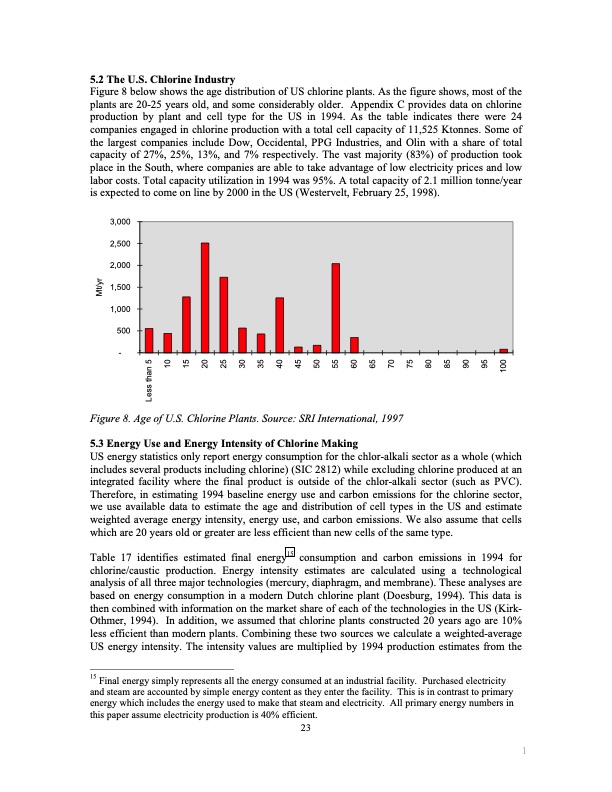
5.2 The U.S. Chlorine Industry Figure 8 below shows the age distribution of US chlorine plants. As the figure shows, most of the plants are 20-25 years old, and some considerably older. Appendix C provides data on chlorine production by plant and cell type for the US in 1994. As the table indicates there were 24 companies engaged in chlorine production with a total cell capacity of 11,525 Ktonnes. Some of the largest companies include Dow, Occidental, PPG Industries, and Olin with a share of total capacity of 27%, 25%, 13%, and 7% respectively. The vast majority (83%) of production took place in the South, where companies are able to take advantage of low electricity prices and low labor costs. Total capacity utilization in 1994 was 95%. A total capacity of 2.1 million tonne/year is expected to come on line by 2000 in the US (Westervelt, February 25, 1998). 3,000 2,500 2,000 1,500 1,000 500 - Figure 8. Age of U.S. Chlorine Plants. Source: SRI International, 1997 5.3 Energy Use and Energy Intensity of Chlorine Making US energy statistics only report energy consumption for the chlor-alkali sector as a whole (which includes several products including chlorine) (SIC 2812) while excluding chlorine produced at an integrated facility where the final product is outside of the chlor-alkali sector (such as PVC). Therefore, in estimating 1994 baseline energy use and carbon emissions for the chlorine sector, we use available data to estimate the age and distribution of cell types in the US and estimate weighted average energy intensity, energy use, and carbon emissions. We also assume that cells which are 20 years old or greater are less efficient than new cells of the same type. Table 17 identifies estimated final energy15 consumption and carbon emissions in 1994 for chlorine/caustic production. Energy intensity estimates are calculated using a technological analysis of all three major technologies (mercury, diaphragm, and membrane). These analyses are based on energy consumption in a modern Dutch chlorine plant (Doesburg, 1994). This data is then combined with information on the market share of each of the technologies in the US (Kirk- Othmer, 1994). In addition, we assumed that chlorine plants constructed 20 years ago are 10% less efficient than modern plants. Combining these two sources we calculate a weighted-average US energy intensity. The intensity values are multiplied by 1994 production estimates from the 15 Final energy simply represents all the energy consumed at an industrial facility. Purchased electricity and steam are accounted by simple energy content as they enter the facility. This is in contrast to primary energy which includes the energy used to make that steam and electricity. All primary energy numbers in this paper assume electricity production is 40% efficient. 23 1 Less than 5 10 15 20 25 30 35 40 45 50 55 60 65 70 75 80 85 90 95 100 Mt/yrPDF Image | Energy use and energy intensity
PDF Search Title:
Energy use and energy intensityOriginal File Name Searched:
qt2925w8g6.pdfDIY PDF Search: Google It | Yahoo | Bing
Salgenx Redox Flow Battery Technology: Power up your energy storage game with Salgenx Salt Water Battery. With its advanced technology, the flow battery provides reliable, scalable, and sustainable energy storage for utility-scale projects. Upgrade to a Salgenx flow battery today and take control of your energy future.
| CONTACT TEL: 608-238-6001 Email: greg@salgenx.com | RSS | AMP |