PDF Publication Title:
Text from PDF Page: 075
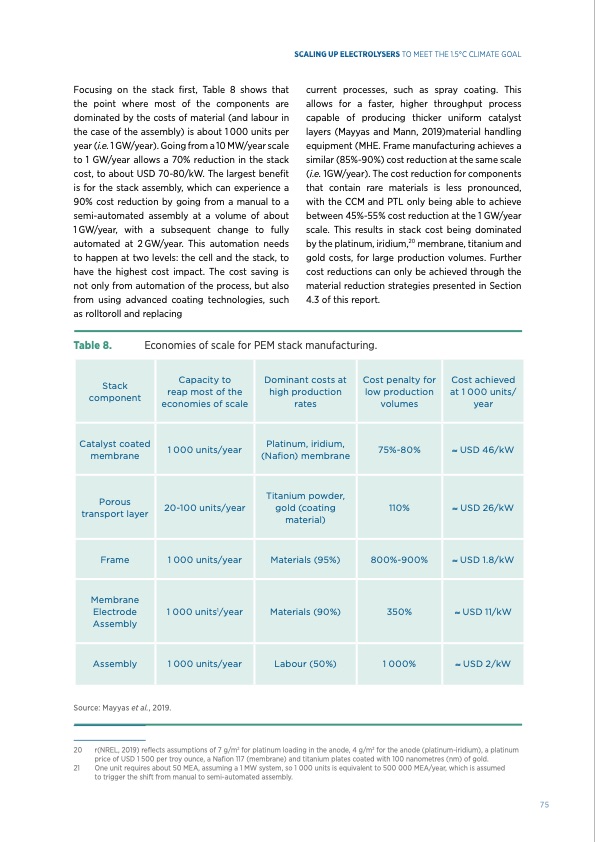
Focusing on the stack first, Table 8 shows that the point where most of the components are dominated by the costs of material (and labour in the case of the assembly) is about 1 000 units per year (i.e. 1 GW/year). Going from a 10 MW/year scale to 1 GW/year allows a 70% reduction in the stack cost, to about USD 70-80/kW. The largest benefit is for the stack assembly, which can experience a 90% cost reduction by going from a manual to a semi-automated assembly at a volume of about 1GW/year, with a subsequent change to fully automated at 2GW/year. This automation needs to happen at two levels: the cell and the stack, to have the highest cost impact. The cost saving is not only from automation of the process, but also from using advanced coating technologies, such as rolltoroll and replacing current processes, such as spray coating. This allows for a faster, higher throughput process capable of producing thicker uniform catalyst layers (Mayyas and Mann, 2019)material handling equipment (MHE. Frame manufacturing achieves a similar (85%-90%) cost reduction at the same scale (i.e. 1GW/year). The cost reduction for components that contain rare materials is less pronounced, with the CCM and PTL only being able to achieve between 45%-55% cost reduction at the 1 GW/year scale. This results in stack cost being dominated by the platinum, iridium,20 membrane, titanium and gold costs, for large production volumes. Further cost reductions can only be achieved through the material reduction strategies presented in Section 4.3 of this report. SCALING UP ELECTROLYSERS TO MEET THE 1.5°C CLIMATE GOAL Table 8. Economies of scale for PEM stack manufacturing. Stack component Capacity to reap most of the economies of scale Dominant costs at high production rates Cost penalty for low production volumes Cost achieved at 1 000 units/ year Catalyst coated membrane 1 000 units/year Platinum, iridium, (Nafion) membrane 75%-80% ≈ USD 46/kW Porous transport layer 20-100 units/year Titanium powder, gold (coating material) 110% ≈ USD 26/kW Frame 1 000 units/year Materials (95%) 800%-900% ≈ USD 1.8/kW Membrane Electrode Assembly 1 000 units1/year Materials (90%) 350% ≈ USD 11/kW Assembly 1 000 units/year Labour (50%) 1 000% ≈ USD 2/kW Source: Mayyas et al., 2019. 20 r(NREL, 2019) reflects assumptions of 7 g/m2 for platinum loading in the anode, 4 g/m2 for the anode (platinum-iridium), a platinum price of USD 1 500 per troy ounce, a Nafion 117 (membrane) and titanium plates coated with 100 nanometres (nm) of gold. 21 One unit requires about 50 MEA, assuming a 1 MW system, so 1 000 units is equivalent to 500 000 MEA/year, which is assumed to trigger the shift from manual to semi-automated assembly. 75PDF Image | GREEN HYDROGEN SCALING UP ELECTROLYSERS
PDF Search Title:
GREEN HYDROGEN SCALING UP ELECTROLYSERSOriginal File Name Searched:
IRENA_Green_hydrogen_cost_2020.pdfDIY PDF Search: Google It | Yahoo | Bing
Salgenx Redox Flow Battery Technology: Power up your energy storage game with Salgenx Salt Water Battery. With its advanced technology, the flow battery provides reliable, scalable, and sustainable energy storage for utility-scale projects. Upgrade to a Salgenx flow battery today and take control of your energy future.
| CONTACT TEL: 608-238-6001 Email: greg@salgenx.com | RSS | AMP |