PDF Publication Title:
Text from PDF Page: 009
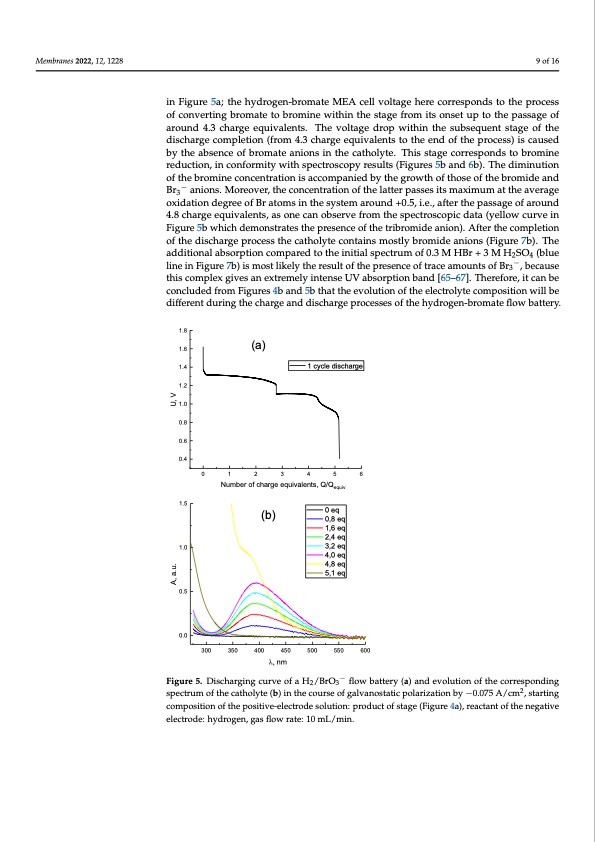
Membranes 2022, 12, 1228 ing compounds in an oxidation state below (+5). Finally, we observed only the side reac- tion of water electrolysis with the O2 release after 8.2 charge equivalents. Before the discharge, the spectra indicate the absence of both Br2 and HBrO, which have absorption bands at 396 nm and 266 nm, respectively [65–67]. Therefore, the electro- lyte contains only the bromate anion. The beginning of the discharge curve is demon- 9 of 16 strated in Figure 5a; the hydrogen-bromate MEA cell voltage here corresponds to the pro- cess of converting bromate to bromine within the stage from its onset up to the passage Membranes 2022, 12, x FOR PEER REVIEW 10 of 17 of around 4.3 charge equivalents. The voltage drop within the subsequent stage of the in Figure 5a; the hydrogen-bromate MEA cell voltage here corresponds to the process discharge completion (from 4.3 charge equivalents to the end of the process) is caused by of converting bromate to bromine within the stage from its onset up to the passage of the absence of bromate anions in the catholyte. This stage corresponds to bromine reduc- around 4.3 charge equivalents. The voltage drop within the subsequent stage of the tion, in conformity with spectroscopy results (Figures 5b and 6b). The diminution of the discharge completion (from 4.3 charge equivalents to the end of the process) is caused bromine concentration is accompanied by the growth of those of the bromide and Br3− by the absence of bromate anions in the catholyte. This stage corresponds to bromine anions. Moreover, the concentration of the latter passes its maximum at the average oxi- reduction, in conformity with spectroscopy results (Figures 5b and 6b). The diminution dation degree of Br atoms in the system around +0.5, i.e., after the passage of around 4.8 of the bromine concentration is accompanied by the growth of those of the bromide and − charge equivalents, as one can observe from the spectroscopic data (yellow curve in Figure Br3 anions. Moreover, the concentration of the latter passes its maximum at the average 5b which demonstrates the presence of the tribromide anion). After the completion of the oxidation degree of Br atoms in the system around +0.5, i.e., after the passage of around discharge process the catholyte contains mostly bromide anions (Figure 7b). The addi- 4.8 charge equivalents, as one can observe from the spectroscopic data (yellow curve in tional absorption compared to the initial spectrum of 0.3 M HBr + 3 M H2SO4 (blue line in Figure 5b which demonstrates the presence of the tribromide anion). After the completion − Figureo7fbt)hiesdmisocshtalirkgelyprtohceersesstuhletocfathoelyptresceoncteaionfstmraocestalymboruonmtsidoefaBnr3io,nbse(cFaiugsuerteh7isb).The compleaxdgdivtieosnanlaebxtsroermpteiloyninctoemnspeaUreVdatobstohrepitnioitniablasnpdec[t6r5u–m67o].fT0h.3erMefoHrBe,rit+c3anMbHecoSnO- (blue 24 − differenthtisducorimngpltehxegcihveasrgaenaenxdtredmiseclhyairngteenpsreocUeVsseasbsoofrtphteiohnybdarnodge[n65-b–r6o7m]. aTtheefrleofworeb,aitt- can be cludedlifnreominFigures7b4b)isanmdo5stblitkhealtyttheeervesoululttiofnthoefpthresenleccetroofltyrtaececoampoousnitsioonfwBrillb,ebecause 3 tery. concluded from Figures 4b and 5b that the evolution of the electrolyte composition will be different during the charge and discharge processes of the hydrogen-bromate flow battery. 1.8 1.6 1.4 1.2 1.0 0.8 0.6 0.4 1.5 1.0 0.5 0.0 (a) 0123456 300 350 400 450 l, nm Number of charge equivalents, Q/Qequiv (b) 0 eq 0,8 eq 1,6 eq 2,4 eq 3,2 eq 4,0 eq 4,8 eq 5,1 eq 500 550 600 1 cycle discharge Figure 5. Discharging curve of a H2/BrO3− flow battery (a) and evolution of the corresponding Figure 5. Discharging curve of a H2/BrO3− flow battery (a) and evolution of the corresponding sp2ec- spectrum of the catholyte (b) in the course of galvanostatic polarization by −0.075 A/cm , starting trum of the catholyte (b) in the course of galvanostatic polarization by −0.075 A/cm2, starting com- composition of the positive-electrode solution: product of stage (Figure 4a), reactant of the negative position of the positive-electrode solution: product of stage (Figure 4a), reactant of the negative elec- electrode: hydrogen, gas flow rate: 10 mL/min. 2.0 curve 1 1.6 curve 2 1.2 0.8 trode: hydrogen, gas flow rate: 10 mL/min. (a) U, V A, a.u. U, VPDF Image | Hydrogen-Bromate Flow Battery
PDF Search Title:
Hydrogen-Bromate Flow BatteryOriginal File Name Searched:
membranes-12-01228-v2.pdfDIY PDF Search: Google It | Yahoo | Bing
Salgenx Redox Flow Battery Technology: Power up your energy storage game with Salgenx Salt Water Battery. With its advanced technology, the flow battery provides reliable, scalable, and sustainable energy storage for utility-scale projects. Upgrade to a Salgenx flow battery today and take control of your energy future.
CONTACT TEL: 608-238-6001 Email: greg@salgenx.com (Standard Web Page)