PDF Publication Title:
Text from PDF Page: 011
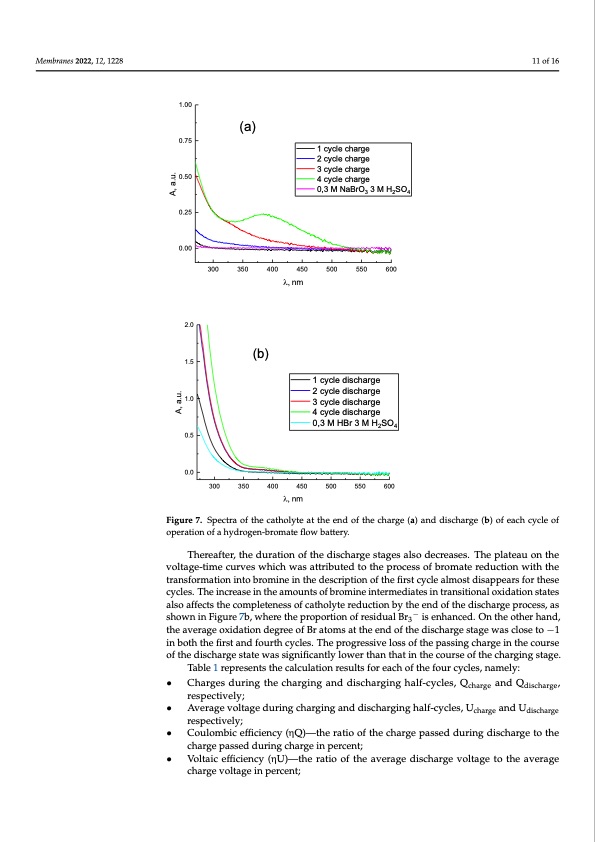
Membranes 2022, 12, x FOR PEER REVIEW Membranes 2022, 12, 1228 11 of 17 11 of 16 1.00 0.75 0.50 0.25 0.00 2.0 1.5 1.0 0.5 0.0 (a) 1 cycle charge 2 cycle charge 3 cycle charge 4 cycle charge 0,3 M NaBrO3 3 M H2SO4 A, a.u. A, a.u. 300 350 400 (b) 350 400 450 500 l, nm 550 600 300 1 cycle discharge 2 cycle discharge 3 cycle discharge 4 cycle discharge 0,3 M HBr 3 M H2SO4 450 500 550 600 l, nm Figure 7. Spectra of the catholyte at the end of the charge (a) and discharge (b) of each cycle of Figure 7. Spectra of the catholyte at the end of the charge (a) and discharge (b) of each cycle of operation of a hydrogen-bromate flow battery. operation of a hydrogen-bromate flow battery. Thereafter, the duration of the discharge stages also decreases. The plateau on the Figure 6 represents the results of a hydrogen bromate flow battery under cyclic test- voltage-time curves which was attributed to the process of bromate reduction with the ing with an extended duration over a voltage range of 0.4–1.9 V. In addition to the time transformation into bromine in the description of the first cycle almost disappears for these dependence of the voltage (Figure 6a, curve 1), the potential of the positive electrode rel- cycles. The increase in the amounts of bromine intermediates in transitional oxidation states ative to the silver chloride reference electrode was registered (Figure 6a, curve 2). The also affects the completeness of catholyte reduction by the end of the discharge process, as processing of catholyte spectra in these tests was carried out according to the procedure shown in Figure 7b, where the proportion of residual Br3 is enhanced. On the other hand, describthedeainvetrhaegewoxrikdoatfioPnetdroevgreteaol.f[B6r8a]tomisoalattehetheenmdofletchueladrisbcrhoamrgienestfargaectwioansfcrlomseto−1 theoveinrablloathbstohrepfitirosntasnpdecftorua.rtThhceyrcelseus.ltTihsedepmroognrestsrsaivtedloinssFoigfuthre6pbasassinagdcehpaerngdeeinctehoefcourse the reloaftitvheeadmisocuhnartgoefsbtraotemwinaesastiogmnisficinantthlye flowrmerotfhBanr2tmhaotleincuthleescwouitrhsereogfatrhdescthoatrigmineg. stage. While collaTtianbgleth1erecpurevsesnftosrthceyclaelscu2l–a4tiwonitrhesthueltspfroervieoauchslyofdtihsecufossuerdcydcalteas,fonramthelyfi:rst cycle a noticeable difference was revealed: as the cycle number increases, its duration de- • Charges during the charging and discharging half-cycles, Qcharge and Qdischarge, creases, mainly due to the diminishing of the charging half-cycle stage, responsible for the respectively; rise of the bromine oxidation state from +1 to +5. As a result, the catholyte contains a bro- • Average voltage during charging and discharging half-cycles, Ucharge and Udischarge mate ion concentration decreasing from cycle to cycle by the moment the system reaches respectively; the current reversal voltage (1.9 V). At the same time, the proportion of bromine atoms in • Coulombic efficiency (ηQ)—the ratio of the charge passed during discharge to the the form of HBrO increases. This corresponds to an increase in UV absorption (Figure 7a) charge passed during charge in percent; compared to an acidic solution of sodium bromate, caused by intermediates with bromine • Voltaic efficiency (ηU)—the ratio of the average discharge voltage to the average oxidation states +1, +3 for cycles 2–3. A noticeable contribution of molecular bromine charge voltage in percent; −PDF Image | Hydrogen-Bromate Flow Battery
PDF Search Title:
Hydrogen-Bromate Flow BatteryOriginal File Name Searched:
membranes-12-01228-v2.pdfDIY PDF Search: Google It | Yahoo | Bing
Salgenx Redox Flow Battery Technology: Power up your energy storage game with Salgenx Salt Water Battery. With its advanced technology, the flow battery provides reliable, scalable, and sustainable energy storage for utility-scale projects. Upgrade to a Salgenx flow battery today and take control of your energy future.
| CONTACT TEL: 608-238-6001 Email: greg@salgenx.com | RSS | AMP |