PDF Publication Title:
Text from PDF Page: 019
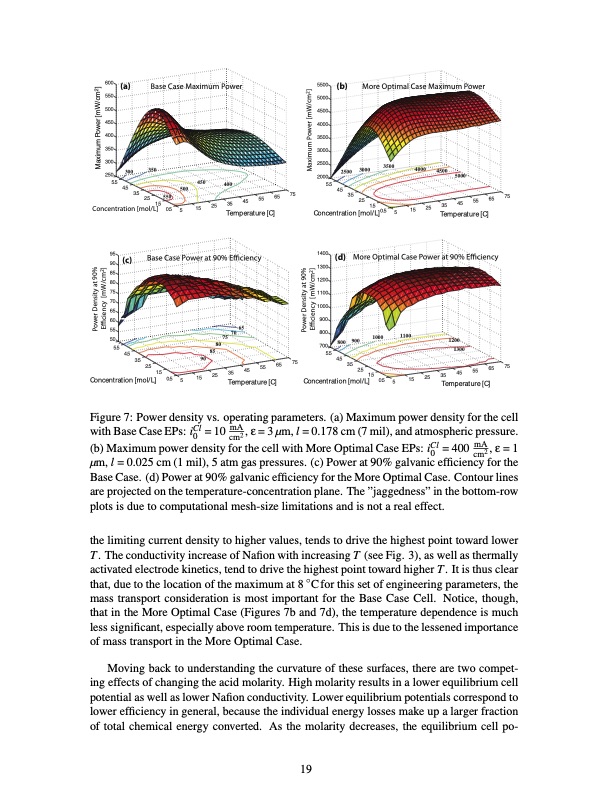
600 (a) 550 500 450 400 350 300 250 Base Case Maximum Power 350 3.5 Concentration [mol/L] 0.5 300 5.5 4.5 450 500 5 15 400 2.5 550 1.5 45 55 65 Temperature [C] 75 25 35 5500 5000 4500 4000 3500 3000 2500 2000 (b) More Optimal Case Maximum Power 2500 3000 3500 4000 25 4500 45 55 65 Temperature [C] 5000 5.5 4.5 3.5 Concentration [mol/L]0.5 75 2.5 1.5 5 15 35 95 90 85 80 75 70 65 60 55 50 5.5 1400 (d) 1300 1200 1100 1000 900 800 700 800 900 5.5 (c) 4.5 Base Case Power at 90% Efficiency More Optimal Case Power at 90% Efficiency Concentration [mol/L] 0.5 5 15 25 0.5 5 2.5 1.5 55 65 3.5 35 45 2.5 1.5 Temperature [C] Concentration [mol/L] 45 55 65 15 25 35 Temperature [C] 75 85 80 75 70 1000 1100 1200 1300 3.5 90 75 4.5 65 Figure 7: Power density vs. operating parameters. (a) Maximum power density for the cell with Base Case EPs: iCl = 10 mA , ε = 3 μm, l = 0.178 cm (7 mil), and atmospheric pressure. 0 cm2 (b) Maximum power density for the cell with More Optimal Case EPs: iCl = 400 mA , ε = 1 0 cm2 μm, l = 0.025 cm (1 mil), 5 atm gas pressures. (c) Power at 90% galvanic efficiency for the Base Case. (d) Power at 90% galvanic efficiency for the More Optimal Case. Contour lines are projected on the temperature-concentration plane. The ”jaggedness” in the bottom-row plots is due to computational mesh-size limitations and is not a real effect. the limiting current density to higher values, tends to drive the highest point toward lower T . The conductivity increase of Nafion with increasing T (see Fig. 3), as well as thermally activated electrode kinetics, tend to drive the highest point toward higher T . It is thus clear that, due to the location of the maximum at 8 ◦Cfor this set of engineering parameters, the mass transport consideration is most important for the Base Case Cell. Notice, though, that in the More Optimal Case (Figures 7b and 7d), the temperature dependence is much less significant, especially above room temperature. This is due to the lessened importance of mass transport in the More Optimal Case. Moving back to understanding the curvature of these surfaces, there are two compet- ing effects of changing the acid molarity. High molarity results in a lower equilibrium cell potential as well as lower Nafion conductivity. Lower equilibrium potentials correspond to lower efficiency in general, because the individual energy losses make up a larger fraction of total chemical energy converted. As the molarity decreases, the equilibrium cell po- 19 Power Density at 90% Efficiency [mW/cm2] Maximum Power [mW/cm2] Power Density at 90% Efficiency [mW/cm2] Maximum Power [mW/cm2]PDF Image | Regenerative Hydrogen Chlorine Fuel Cell for Grid-Scale
PDF Search Title:
Regenerative Hydrogen Chlorine Fuel Cell for Grid-ScaleOriginal File Name Searched:
mja209.pdfDIY PDF Search: Google It | Yahoo | Bing
Salgenx Redox Flow Battery Technology: Power up your energy storage game with Salgenx Salt Water Battery. With its advanced technology, the flow battery provides reliable, scalable, and sustainable energy storage for utility-scale projects. Upgrade to a Salgenx flow battery today and take control of your energy future.
CONTACT TEL: 608-238-6001 Email: greg@salgenx.com (Standard Web Page)