PDF Publication Title:
Text from PDF Page: 002
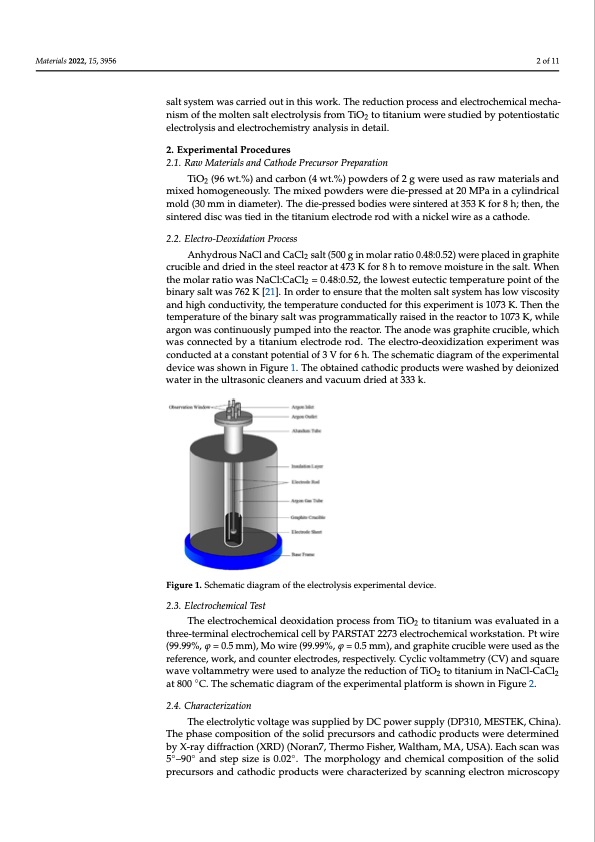
Materials 2022, 15, x FOR PEER REVIEW 2 of 11 Materials 2022, 15, 3956 2 of 11 In order to clarify the deoxidation process of TiO2 in molten salt electrolysis, the prep- aration of titanium by direct electro-deoxidation of TiO2 in NaCl-CaCl2 binary molten salt system was carried out in this work. The reduction process and electrochemical mecha- salt system was carried out in this work. The reduction process and electrochemical mecha- nism of the molten salt electrolysis from TiO2 to titanium were studied by potentiostatic nismofthemoltensaltelectrolysisfromTiO totitaniumwerestudiedbypotentiostatic electrolysis and electrochemistry analysis in d2 etail. electrolysis and electrochemistry analysis in detail. 2. Experimental Procedures 2. Experimental Procedures 2.1. Raw Materials and Cathode Precursor Preparation 2.1. Raw Materials and Cathode Precursor Preparation TiO2 (96 wt.%) and carbon (4 wt.%) powders of 2 g were used as raw materials and TiO2 (96 wt.%) and carbon (4 wt.%) powders of 2 g were used as raw materials and mixed homogeneously. The mixed powders were die-pressed at 20 MPa in a cylindrical mixed homogeneously. The mixed powders were die-pressed at 20 MPa in a cylindrical mold (30 mm in diameter). The die-pressed bodies were sintered at 353 K for 8 h; then, the mold (30 mm in diameter). The die-pressed bodies were sintered at 353 K for 8 h; then, the sintered disc was tied in the titanium electrode rod with a nickel wire as a cathode. sintered disc was tied in the titanium electrode rod with a nickel wire as a cathode. 2.2. Electro-Deoxidation Process 2.2. Electro-Deoxidation Process Anhydrous NaCl and CaCl2 salt (500 g in molar ratio 0.48:0.52) were placed in graph- Anhydrous NaCl and CaCl2 salt (500 g in molar ratio 0.48:0.52) were placed in graphite citreucirbulceibanledadnrdiedrinedthiensttheelsrteaecltroeraacto4r73atK47fo3rK8 hfotro8rehmtovremovisetumreoinstuthre sinalt.hWe shaelnt. tWhehemnotlhaer mraotiloarwrastioNwaCasl:CNaCll:C=a0C.4l28=:0..5428,:0th.5e2,lothweelsotweuestetcetuictetcetmicptemraptuereatpuoreinptoifnthoef 2 bthineabriynsaarlyt swaaltsw76a2s K76[21K].[I2n1]o.rIdneorrtdoeerntsouernestuhraet theatmthoeltemnoslateltnssyaslttesmyshteams lohwasvlioswcosviitsy- acnosdithyigahndcohnidguhcctiovnitdyu,tchtievtiteym,ptheerateumrepceornatduurcetecdonfdorutchteisdefxopretrhimiseenxtpiesr1im07e3nKt.isTh10e7n3thKe. tTehmepnetrhaetuteremopfetrhaetubrienaorfythsealbtiwnarsypsraolgtrwaamsmpraotigcraallmymraaistiecdalilnytrhaeisreedaicntotrhteor1ea07ct3oKr t,ow1h0i7le3 aKr,gwonhiwleaasrcgontiwnuaosucsolnytipnumoupseldyipnutomtphedreinactototrh. eThreaacntord.eThweaasngordapehwitaescgruracpibhliet,ewcrhuichi- wblaes, wcohnicnhecwteads bcoynaneticttaendiubmy aelteitcatrnoiudme reolde.ctrTohdeeerloedct.rTo-hdeeeolxeicdtrizoa-dtieoonxiedxipzeartiomnenextpwerais- cmoenndtuwctaeds caotnadcuocntsetdanattpaocteontsitaalnotfp3oVtefnotria6lho.fT3hVe sfcohre6mha.tiTchdeiasgcrhaemoaftitchdeieaxgpraermimoefntthael dexepviecreimweanstsahlodwevnicienwFiagsusrheo1w.TnhineoFbigtauirnee1d.Tcahtehodbticaipnreoddcuactthsowdeicrepwroadsuhcetdswbyerdeewioansihzed water in the ultrasonic cleaners and vacuum dried at 333 k. by deionized water in the ultrasonic cleaners and vacuum dried at 333 k. Figure 1. Schematic diagram of the electrolysis experimental device. Figure 1. Schematic diagram of the electrolysis experimental device. 2.3. Electrochemical Test 2.3. Electrochemical Test The electrochemical deoxidation process from TiO to titanium was evaluated in a The electrochemical deoxidation process from TiO2 to titanium was evaluated in a three-terminal electrochemical cell by PARSTAT 2273 electrochemical workstation. Pt wire three-terminal electrochemical cell by PARSTAT 2273 electrochemical workstation. Pt wire (99.99%, φ = 0.5 mm), Mo wire (99.99%, φ = 0.5 mm), and graphite crucible were used as the (99.99%, φ = 0.5 mm), Mo wire (99.99%, φ = 0.5 mm), and graphite crucible were used as the reference, work, and counter electrodes, respectively. Cyclic voltammetry (CV) and square reference, work, and counter electrodes, respectively. Cyclic voltammetry (CV) and square wave voltammetry were used to analyze the reduction of TiO2 to titanium in NaCl-CaCl2 wave voltammetry were used to analyze the reduction of TiO2 to titanium in NaCl-CaCl2 at at 800 ◦C. The schematic diagram of the experimental platform is shown in Figure 2. 800 °C. The schematic diagram of the experimental platform is shown in Figure 2. 2.4. Characterization The electrolytic voltage was supplied by DC power supply (DP310, MESTEK, China). The phase composition of the solid precursors and cathodic products were determined by X-ray diffraction (XRD) (Noran7, Thermo Fisher, Waltham, MA, USA). Each scan was 5◦–90◦ and step size is 0.02◦. The morphology and chemical composition of the solid precursors and cathodic products were characterized by scanning electron microscopyPDF Image | Electrochemical Mechanism of Molten Salt Electrolysis
PDF Search Title:
Electrochemical Mechanism of Molten Salt ElectrolysisOriginal File Name Searched:
materials-15-03956.pdfDIY PDF Search: Google It | Yahoo | Bing
Salgenx Redox Flow Battery Technology: Power up your energy storage game with Salgenx Salt Water Battery. With its advanced technology, the flow battery provides reliable, scalable, and sustainable energy storage for utility-scale projects. Upgrade to a Salgenx flow battery today and take control of your energy future.
| CONTACT TEL: 608-238-6001 Email: greg@salgenx.com | RSS | AMP |