PDF Publication Title:
Text from PDF Page: 007
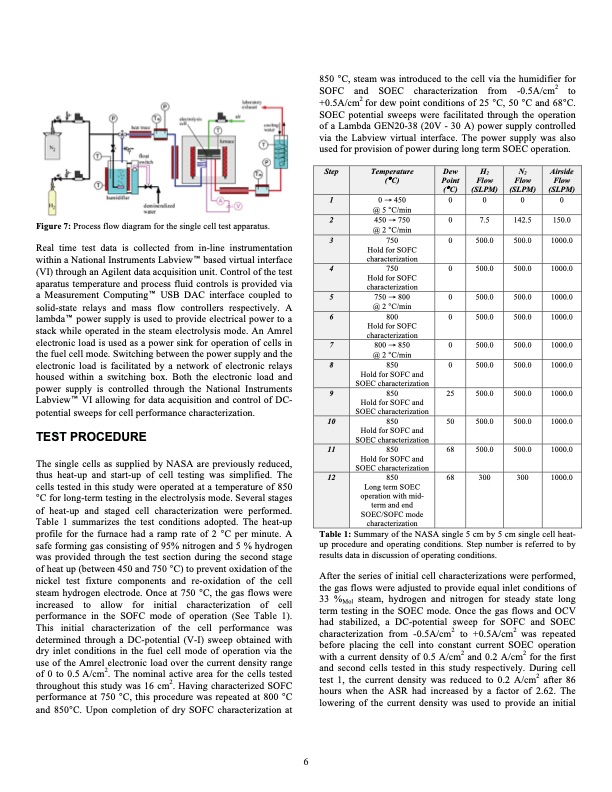
Figure 7: Process flow diagram for the single cell test apparatus. Real time test data is collected from in-line instrumentation within a National Instruments LabviewTM based virtual interface (VI) through an Agilent data acquisition unit. Control of the test aparatus temperature and process fluid controls is provided via a Measurement ComputingTM USB DAC interface coupled to solid-state relays and mass flow controllers respectively. A lambdaTM power supply is used to provide electrical power to a stack while operated in the steam electrolysis mode. An Amrel electronic load is used as a power sink for operation of cells in the fuel cell mode. Switching between the power supply and the electronic load is facilitated by a network of electronic relays housed within a switching box. Both the electronic load and power supply is controlled through the National Instruments LabviewTM VI allowing for data acquisition and control of DC- potential sweeps for cell performance characterization. TEST PROCEDURE The single cells as supplied by NASA are previously reduced, thus heat-up and start-up of cell testing was simplified. The cells tested in this study were operated at a temperature of 850 °C for long-term testing in the electrolysis mode. Several stages of heat-up and staged cell characterization were performed. Table 1 summarizes the test conditions adopted. The heat-up profile for the furnace had a ramp rate of 2 °C per minute. A safe forming gas consisting of 95% nitrogen and 5 % hydrogen was provided through the test section during the second stage of heat up (between 450 and 750 °C) to prevent oxidation of the nickel test fixture components and re-oxidation of the cell steam hydrogen electrode. Once at 750 °C, the gas flows were increased to allow for initial characterization of cell performance in the SOFC mode of operation (See Table 1). This initial characterization of the cell performance was determined through a DC-potential (V-I) sweep obtained with dry inlet conditions in the fuel cell mode of operation via the use of the Amrel electronic load over the current density range of 0 to 0.5 A/cm2. The nominal active area for the cells tested throughout this study was 16 cm2. Having characterized SOFC performance at 750 °C, this procedure was repeated at 800 °C and 850°C. Upon completion of dry SOFC characterization at 850 25 Hold for SOFC and SOEC characterization 850 50 Hold for SOFC and SOEC characterization 850 68 Hold for SOFC and SOEC characterization 68 7.5 142.5 500.0 500.0 500.0 500.0 500.0 500.0 500.0 500.0 500.0 500.0 500.0 500.0 500.0 500.0 500.0 500.0 500.0 500.0 150.0 1000.0 1000.0 1000.0 1000.0 1000.0 1000.0 1000.0 1000.0 1000.0 850 °C, steam was introduced to the cell via the humidifier for SOFC and SOEC characterization from -0.5A/cm2 to +0.5A/cm2 for dew point conditions of 25 °C, 50 °C and 68°C. SOEC potential sweeps were facilitated through the operation of a Lambda GEN20-38 (20V - 30 A) power supply controlled via the Labview virtual interface. The power supply was also used for provision of power during long term SOEC operation. Step Temperature (° C) Dew Point (° C) H2 Flow (SLPM) N2 Flow (SLPM) Airside Flow (SLPM) 1 2 3 4 5 6 7 8 9 10 11 12 850 Long term SOEC operation with mid- term and end SOEC/SOFC mode characterization 300 300 1000.0 0→450 @ 5 °C/min 450 → 750 @ 2 °C/min 750 Hold for SOFC characterization 750 Hold for SOFC characterization 750 → 800 @ 2 °C/min 800 Hold for SOFC characterization 800 → 850 @ 2 °C/min 850 Hold for SOFC and SOEC characterization 0 0 0 0 0 0 0 0 0 0 0 6 Table 1: Summary of the NASA single 5 cm by 5 cm single cell heat- up procedure and operating conditions. Step number is referred to by results data in discussion of operating conditions. After the series of initial cell characterizations were performed, the gas flows were adjusted to provide equal inlet conditions of 33 %Mol steam, hydrogen and nitrogen for steady state long term testing in the SOEC mode. Once the gas flows and OCV had stabilized, a DC-potential sweep for SOFC and SOEC characterization from -0.5A/cm2 to +0.5A/cm2 was repeated before placing the cell into constant current SOEC operation with a current density of 0.5 A/cm2 and 0.2 A/cm2 for the first and second cells tested in this study respectively. During cell test 1, the current density was reduced to 0.2 A/cm2 after 86 hours when the ASR had increased by a factor of 2.62. The lowering of the current density was used to provide an initialPDF Image | Electrolysis Cells Operated Fuel Cell Steam Electrolysis
PDF Search Title:
Electrolysis Cells Operated Fuel Cell Steam ElectrolysisOriginal File Name Searched:
5223026.pdfDIY PDF Search: Google It | Yahoo | Bing
Salgenx Redox Flow Battery Technology: Power up your energy storage game with Salgenx Salt Water Battery. With its advanced technology, the flow battery provides reliable, scalable, and sustainable energy storage for utility-scale projects. Upgrade to a Salgenx flow battery today and take control of your energy future.
| CONTACT TEL: 608-238-6001 Email: greg@salgenx.com | RSS | AMP |