PDF Publication Title:
Text from PDF Page: 031
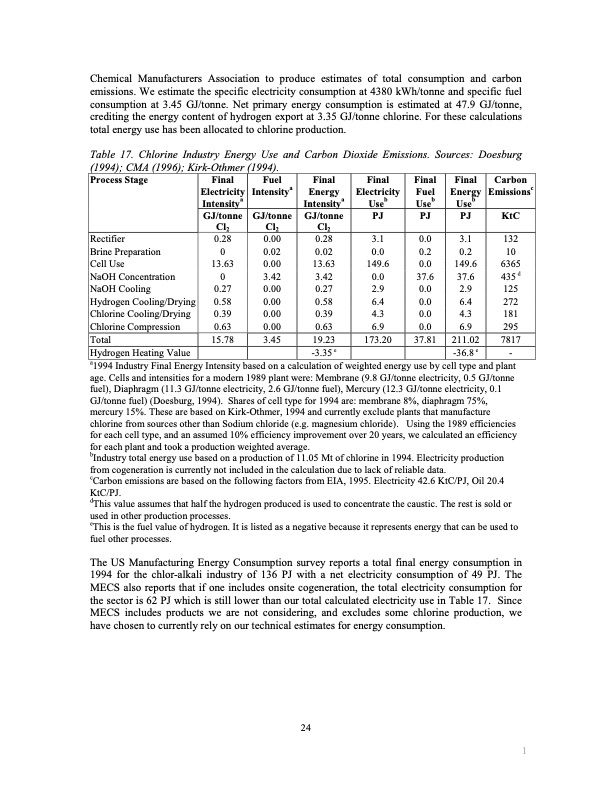
Chemical Manufacturers Association to produce estimates of total consumption and carbon emissions. We estimate the specific electricity consumption at 4380 kWh/tonne and specific fuel consumption at 3.45 GJ/tonne. Net primary energy consumption is estimated at 47.9 GJ/tonne, crediting the energy content of hydrogen export at 3.35 GJ/tonne chlorine. For these calculations total energy use has been allocated to chlorine production. Table 17. Chlorine Industry Energy Use and Carbon Dioxide Emissions. Sources: Doesburg (1994); CMA (1996); Kirk-Othmer (1994). Process Stage Final Fuel Electricity Intensitya Final Final Energy Electricity Final Fuel Useb PJ Final Carbon Energy Emissionsc Intensitya GJ/tonne GJ/tonne GJ/tonne PJ KtC Intensitya Useb Cl2 Useb PJ Cl2 Cl2 Rectifier Brine Preparation Cell Use NaOH Concentration NaOH Cooling Hydrogen Cooling/Drying Chlorine Cooling/Drying Chlorine Compression Total Hydrogen Heating Value a1994 Industry Final Energy Intensity based on a calculation of weighted energy use by cell type and plant age. Cells and intensities for a modern 1989 plant were: Membrane (9.8 GJ/tonne electricity, 0.5 GJ/tonne fuel), Diaphragm (11.3 GJ/tonne electricity, 2.6 GJ/tonne fuel), Mercury (12.3 GJ/tonne electricity, 0.1 GJ/tonne fuel) (Doesburg, 1994). Shares of cell type for 1994 are: membrane 8%, diaphragm 75%, mercury 15%. These are based on Kirk-Othmer, 1994 and currently exclude plants that manufacture chlorine from sources other than Sodium chloride (e.g. magnesium chloride). Using the 1989 efficiencies for each cell type, and an assumed 10% efficiency improvement over 20 years, we calculated an efficiency for each plant and took a production weighted average. bIndustry total energy use based on a production of 11.05 Mt of chlorine in 1994. Electricity production from cogeneration is currently not included in the calculation due to lack of reliable data. cCarbon emissions are based on the following factors from EIA, 1995. Electricity 42.6 KtC/PJ, Oil 20.4 KtC/PJ. dThis value assumes that half the hydrogen produced is used to concentrate the caustic. The rest is sold or used in other production processes. eThis is the fuel value of hydrogen. It is listed as a negative because it represents energy that can be used to fuel other processes. The US Manufacturing Energy Consumption survey reports a total final energy consumption in 1994 for the chlor-alkali industry of 136 PJ with a net electricity consumption of 49 PJ. The MECS also reports that if one includes onsite cogeneration, the total electricity consumption for the sector is 62 PJ which is still lower than our total calculated electricity use in Table 17. Since MECS includes products we are not considering, and excludes some chlorine production, we have chosen to currently rely on our technical estimates for energy consumption. 0.28 0.00 0 0.02 13.63 0.00 0 3.42 0.27 0.00 0.58 0.00 0.39 0.00 0.63 0.00 15.78 3.45 0.28 3.1 0.0 0.2 0.0 37.6 0.0 2.9 0.0 6.4 0.0 4.3 0.0 6.9 132 10 6365 435 d 125 272 181 295 7817 - 0.02 0.0 13.63 149.6 3.42 0.0 0.2 149.6 37.6 0.27 2.9 0.58 6.4 0.39 4.3 0.63 6.9 3.1 19.23 173.20 -3.35 e 37.81 211.02 -36.8 e 24 1PDF Image | Energy use and energy intensity
PDF Search Title:
Energy use and energy intensityOriginal File Name Searched:
qt2925w8g6.pdfDIY PDF Search: Google It | Yahoo | Bing
Salgenx Redox Flow Battery Technology: Power up your energy storage game with Salgenx Salt Water Battery. With its advanced technology, the flow battery provides reliable, scalable, and sustainable energy storage for utility-scale projects. Upgrade to a Salgenx flow battery today and take control of your energy future.
CONTACT TEL: 608-238-6001 Email: greg@salgenx.com (Standard Web Page)