PDF Publication Title:
Text from PDF Page: 013
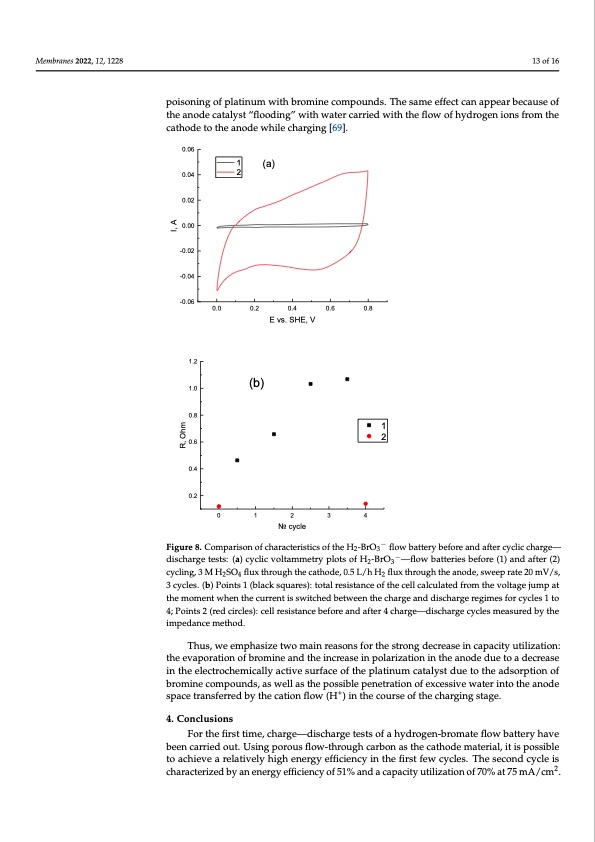
Anodic half-cell 0 0.06 1.6 Total amount of bromine atoms 3.98 3.19 80.2 Membranes 2022, 12, 1228 The results of the analysis of the electrode potential variation during cycling are demonstrated in Figure 6a, curve 1. The charging segments of this dependence indicate 13 of 16 that the overvoltage of the catholyte oxidation decreases from cycle to cycle. This decrease is caused by the growth of the surface of the positive electrode. This is clearly evidenced by an increase in its capacitive current of more than 20 times after cycling, compared to poisoning of platinum with bromine compounds. The same effect can appear because of that before cycling, according to the CV measurements in Figure 8a. the anode catalyst “flooding” with water carried with the flow of hydrogen ions from the cathode to the anode while charging [69]. 0.06 0.04 0.02 0.00 -0.02 -0.04 -0.06 1.2 1.0 0.8 0.6 0.4 0.2 1 2 (a) 0.0 0.2 0.4 0.6 0.8 E vs. SHE, V (b) 01234 No cycle Figure 8. Comparison of characteristics of the H2-BrO3− flow battery before and after cyclic charge— Figure 8. Comparison of characteristics of the H2-BrO3− flow batt−ery before and after cyclic charge— discharge tests: (a) cyclic voltammetry plots of H2-BrO3 —flow batteries before (1) and after (2) discharge tests: (a) cyclic voltammetry plots of H2-BrO3−—flow batteries before (1) and after (2) cy- cycling, 3 M H2SO4 flux through the cathode, 0.5 L/h H2 flux through the anode, sweep rate 20 mV/s, cling, 3 M H2SO4 flux through the cathode, 0.5 L/h H2 flux through the anode, sweep rate 20 mV/s, 3 cycles. (b) Points 1 (black squares): total resistance of the cell calculated from the voltage jump at 3 cycles. (b) Points 1 (black squares): total resistance of the cell calculated from the voltage jump at the moment when the current is switched between the charge and discharge regimes for cycles 1 to the moment when the current is switched between the charge and discharge regimes for cycles 1 to 4; Points 2 (red circles): cell resistance before and after 4 charge—discharge cycles measured by the 4; Points 2 (red circles): cell resistance before and after 4 charge—discharge cycles measured by the impedance method. impedance method. Thus, we emphasize two main reasons for the strong decrease in capacity utilization: Subsequently, the harging current density or the charge transfer voltage is reduced. the evaporation of bromine and the increase in polarization in the anode due to a decrease It should be emphasized that the increasing capacitance/development of the surface are in the electrochemically active surface of the platinum catalyst due to the adsorption of bromine compounds, as well as the possible penetration of excessive water into the anode space transferred by the cation flow (H+) in the course of the charging stage. 4. Conclusions For the first time, charge—discharge tests of a hydrogen-bromate flow battery have been carried out. Using porous flow-through carbon as the cathode material, it is possible to achieve a relatively high energy efficiency in the first few cycles. The second cycle is characterized by an energy efficiency of 51% and a capacity utilization of 70% at 75 mA/cm2. 1 2 R, Ohm I, APDF Image | Hydrogen-Bromate Flow Battery
PDF Search Title:
Hydrogen-Bromate Flow BatteryOriginal File Name Searched:
membranes-12-01228-v2.pdfDIY PDF Search: Google It | Yahoo | Bing
Salgenx Redox Flow Battery Technology: Power up your energy storage game with Salgenx Salt Water Battery. With its advanced technology, the flow battery provides reliable, scalable, and sustainable energy storage for utility-scale projects. Upgrade to a Salgenx flow battery today and take control of your energy future.
| CONTACT TEL: 608-238-6001 Email: greg@salgenx.com | RSS | AMP |