PDF Publication Title:
Text from PDF Page: 011
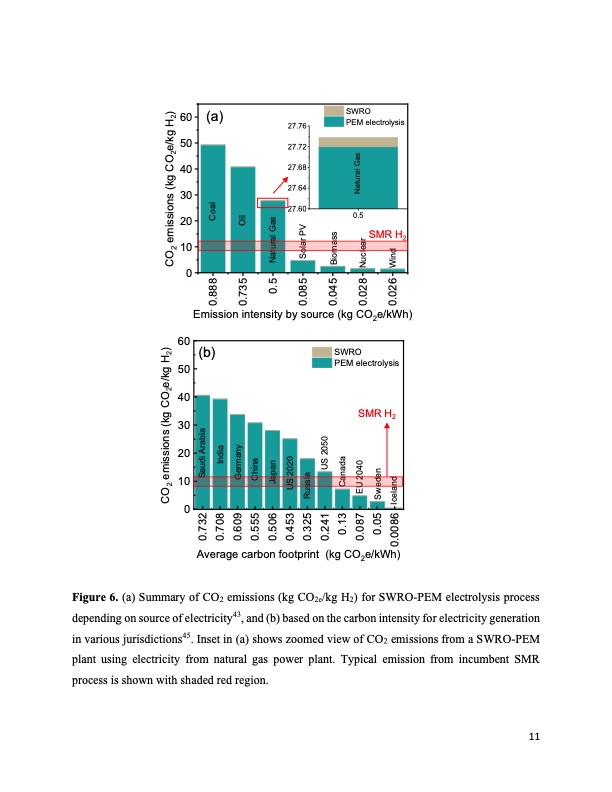
(a) 27.76 27.72 27.68 27.64 27.60 SWRO PEM electrolysis 0.5 SMR H2 60 50 40 30 20 10 0 Emission intensity by source (kg CO2e/kWh) 60 50 40 30 20 10 0 Average carbon footprint (kg CO2e/kWh) Figure 6. (a) Summary of CO2 emissions (kg CO2e/kg H2) for SWRO-PEM electrolysis process depending on source of electricity43, and (b) based on the carbon intensity for electricity generation in various jurisdictions45. Inset in (a) shows zoomed view of CO2 emissions from a SWRO-PEM plant using electricity from natural gas power plant. Typical emission from incumbent SMR process is shown with shaded red region. (b) SWRO PEM electrolysis SMR H2 11 0.732 0.708 0.609 0.555 0.506 0.453 0.325 0.241 Saudi Arabia India 0.888 0.735 Coal Oil 0.13 0.087 0.05 0.0086 US 2050 Canada 0.045 Biomass 0.028 Nuclear 0.026 Wind CO2 emissions (kg CO2e/kg H2) CO2 emissions (kg CO2e/kg H2) Germany China Japan 0.5 Natural Gas 0.085 Solar PV US 2020 Russia EU 2040 Natural Gas Sweden IcelandPDF Image | Seawater Electrolysis for Hydrogen Production
PDF Search Title:
Seawater Electrolysis for Hydrogen ProductionOriginal File Name Searched:
seawater-electrolysis-for-hydrogen-production.pdfDIY PDF Search: Google It | Yahoo | Bing
Salgenx Redox Flow Battery Technology: Power up your energy storage game with Salgenx Salt Water Battery. With its advanced technology, the flow battery provides reliable, scalable, and sustainable energy storage for utility-scale projects. Upgrade to a Salgenx flow battery today and take control of your energy future.
| CONTACT TEL: 608-238-6001 Email: greg@salgenx.com | RSS | AMP |