PDF Publication Title:
Text from PDF Page: 016
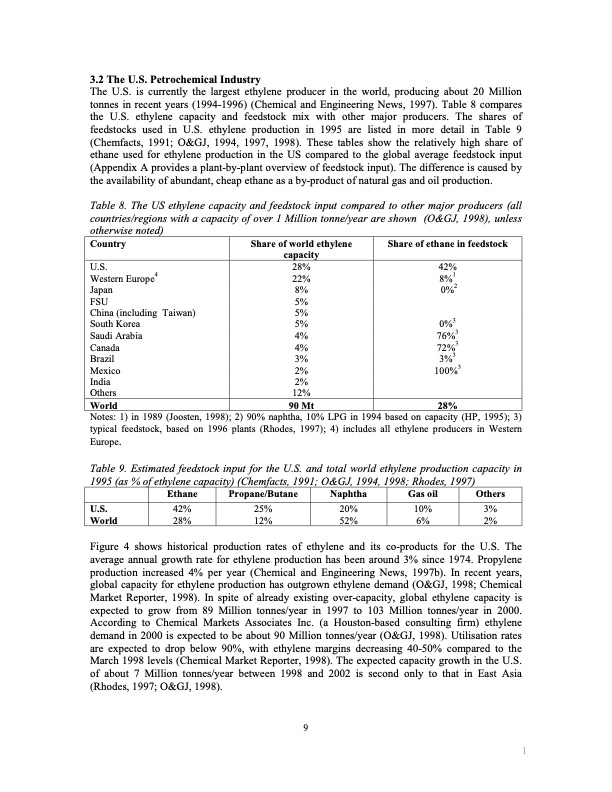
3.2 The U.S. Petrochemical Industry The U.S. is currently the largest ethylene producer in the world, producing about 20 Million tonnes in recent years (1994-1996) (Chemical and Engineering News, 1997). Table 8 compares the U.S. ethylene capacity and feedstock mix with other major producers. The shares of feedstocks used in U.S. ethylene production in 1995 are listed in more detail in Table 9 (Chemfacts, 1991; O&GJ, 1994, 1997, 1998). These tables show the relatively high share of ethane used for ethylene production in the US compared to the global average feedstock input (Appendix A provides a plant-by-plant overview of feedstock input). The difference is caused by the availability of abundant, cheap ethane as a by-product of natural gas and oil production. Table 8. The US ethylene capacity and feedstock input compared to other major producers (all countries/regions with a capacity of over 1 Million tonne/year are shown (O&GJ, 1998), unless otherwise noted) Country Share of world ethylene capacity 28% 22% 8% 5% 5% 5% 4% 4% 3% 2% 2% 12% 90 Mt Share of ethane in feedstock U.S. Western Europe4 Japan FSU China (including Taiwan) South Korea Saudi Arabia Canada Brazil Mexico India Others World Notes: 1) in 1989 (Joosten, 1998); 2) 90% naphtha, 10% LPG in 1994 based on capacity (HP, 1995); 3) typical feedstock, based on 1996 plants (Rhodes, 1997); 4) includes all ethylene producers in Western Europe. Table 9. Estimated feedstock input for the U.S. and total world ethylene production capacity in 1995 (as % of ethylene capacity) (Chemfacts, 1991; O&GJ, 1994, 1998; Rhodes, 1997) 42% 8%1 0%2 0%3 76%3 72%3 3%3 100%3 28% Ethane Propane/Butane Naphtha U.S. 42% 25% 20% World 28% 12% 52% Gas oil Others 10% 3% 6% 2% Figure 4 shows historical production rates of ethylene and its co-products for the U.S. The average annual growth rate for ethylene production has been around 3% since 1974. Propylene production increased 4% per year (Chemical and Engineering News, 1997b). In recent years, global capacity for ethylene production has outgrown ethylene demand (O&GJ, 1998; Chemical Market Reporter, 1998). In spite of already existing over-capacity, global ethylene capacity is expected to grow from 89 Million tonnes/year in 1997 to 103 Million tonnes/year in 2000. According to Chemical Markets Associates Inc. (a Houston-based consulting firm) ethylene demand in 2000 is expected to be about 90 Million tonnes/year (O&GJ, 1998). Utilisation rates are expected to drop below 90%, with ethylene margins decreasing 40-50% compared to the March 1998 levels (Chemical Market Reporter, 1998). The expected capacity growth in the U.S. of about 7 Million tonnes/year between 1998 and 2002 is second only to that in East Asia (Rhodes, 1997; O&GJ, 1998). 9 1PDF Image | Energy use and energy intensity
PDF Search Title:
Energy use and energy intensityOriginal File Name Searched:
qt2925w8g6.pdfDIY PDF Search: Google It | Yahoo | Bing
Salgenx Redox Flow Battery Technology: Power up your energy storage game with Salgenx Salt Water Battery. With its advanced technology, the flow battery provides reliable, scalable, and sustainable energy storage for utility-scale projects. Upgrade to a Salgenx flow battery today and take control of your energy future.
CONTACT TEL: 608-238-6001 Email: greg@salgenx.com (Standard Web Page)